|
| Sunday, April 5, 2009 |
| Enterprise Manager 10g |
Oracle10g Enterprise Manager
Finally, a tool that serves as one-stop-shop for Oracle administration and management—whether by novices or experts
What tool do you use in your day-to-day DBA-related activities? It's a question I asked recently in a user group meeting.
The answers varied depending on the DBA's work experience. Most senior administrators expressed a preference for simple command-line
SQL*Plus (my personal favorite), with the rest dividing their allegiances among a handful of third-party products. The same question, however,
yielded a different response from entry-level DBAs: among that group, Enterprise Manager (EM) was clearly the tool of choice.
It's not hard to understand these preferences. Oracle Enterprise Manager has been steadily perfected since its introduction several years ago,
beginning as the character-mode display SQL*DBA, evolving into a client OS-based tool, and finally taking on a Java flavor. The information
presented by EM was sufficiently detailed for most DBA tasks, serving as a solution for users who were either too reluctant or too busy to learn a
new syntax and wanted a GUI tool for managing common database chores such as adding users, modifying datafiles, and checking on rollback
segments. The diagnostic pack supplied much-needed GUI support for performance tuning.
However, one of the major issues hampering EM's widespread adoption was its inability to keep pace with the development of the database server
itself. For example, the Oracle9i Database version of EM doesn't support subpartitioning, a feature first introduced in Oracle8i.
The new version of EM in Oracle Database 10g changes that equation. It has a new architecture, a new interface, and most important, a very
powerful and complete toolbox catering to all DBA skillsets—from novices to advanced users. And best of all, it's part of the installation itself without
any additional cost. If you are evaluating third-party tools, you can certainly throw EM into the mix to light a fire under the competition. Even if you
are an "in-command-line-we-trust" kind of DBA (like me), you will greatly appreciate how EM can help you in several situations.
In this installment I will introduce you to the new EM. Because the tool is so vast in scope, it will be impossible to cover the entire spectrum of
features; instead, I will explain a few basics and offer pointers to additional material. Keeping in the spirit of this series, I will provide practical
examples that demonstrate the use of the tool to solve real-life problems.
Architecture
EM 10g is installed by default when you install the 10g software. Conceptually, it differs from previous versions in that instead of being a clientinstalled
tool, it's actually an HTTP server (called DB Console) sitting on the database server itself. (See Figure 1.) You can use any browser to see
the EM interface.
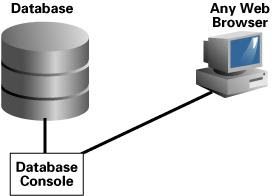
Figure 1: EM Architecture
The port number for DB Console is found in $ORACLE_HOME/install/portlist.ini. Here is an example of a file; ports in your case may be different.
Ultra Search HTTP port number = 5620
iSQL*Plus HTTP port number = 5560
Enterprise Manager Agent Port =
Enterprise Manager Console HTTP Port (starz10) = 5500
Enterprise Manager Agent Port (starz10) = 1830
From this file we know that the Agent for the database starz10 listens on the port 1830 and the EM console listens on 5500. We can invoke the EM
logon screen by entering the following URL:
http://starz/em/console/logon/logon
This URL brings up a logon screen where you can log on as a DBA user. For our example, we will log in as SYS.
Main Database Home Page
After logon, the main database home page comes up. The top portion of the home page enables a quick glance at important details. (See Figure 2.)
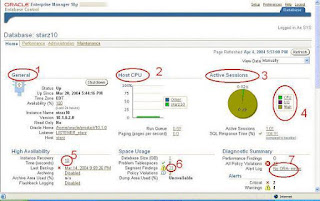
Figure 2: Main Database Home Page (Top)
Some of the most important points in the above figure have been circled and annotated with numbered references in this article. First, note the
section labeled "General" (1); this section shows some most rudimentary details about the database, such as the fact that the database has been
up since March 20 as well as the instance name. The Oracle Home is shown as a hyperlink, which, when clicked, shows all the products and all
other Oracle databases sharing that home. The hyperlink for Listeners shows all the databases and instances registered with the listener, whose
name is shown immediately below. Finally, it shows the host name (starz).
In section named "Host CPU" (2), the CPU details are shown at a glance. Section "Active Sessions" (3) shows the active sessions and what they
are doing at the moment (4). We see from the above that 99% of the time spent by the sessions is in waiting. (We will find the cause of these waits
later.) The section on "High Availability" (5) shows availability-related information. For example, the value of "Instance Recovery Time," which is the
value of MTTR Target for the instance, determines how much time may be required for instance crash recovery.
The section on "Space Usage" (6) is interesting: it shows warnings associated with 23 segments. (Again, more on these warnings later.) The
section "Diagnostic Summary" (7) provides a synopsis of database well being. The number of performance findings indicates how many issues
were proactively identified by the Automatic Database Diagnostic Monitor (ADDM), the new self-diagnostic engine in 10g. EM also automatically
analyzes your environment to determine if any recommended best practices are being violated; the result of this analysis is presented in the "Policy
Violation" section. Finally, EM scans the alert log and shows any recent ORA errors. This information is invaluable—automatic scanning of Oracle
errors in the alert log saves you the considerable trouble of manually searching for them.
The bottom part of the database home page, shown in Figure 3, we see some of these messages in more detail. The section "Alerts" (1) shows all
the relevant alerts that require your attention, each of which can be easily configured. Take the first one (2), for example, which shows that the
Archiver process is hanging for some reason. Of course, the next course of action is to determine why. To find out, just click on it. You will be
shown more details from the alert.log file containing the error. In this case, the culprit was a filled-up flashback recovery area; we just need to clear
it up so the Archiver can start working again.
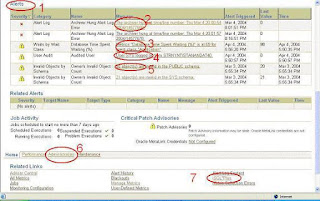
Figure 3: Main Database Home Page (Bottom)
Another alert (3) is about a wait: the database is waiting 69% of the time for a wait related to the wait class "Application." Remember how the top
part of the home page indicates that a session is waiting? This alert shows us what it is waiting on. Clicking on the hyperlink will immediately show
you the actual waits.
The next alert (4) shows an audit entry, that the user SYS connected to the database from a certain client machine. Again, by clicking on the
hyperlink you can reveal all the details about the connection. The last alert (5) shows that some objects are invalid. Clicking on the hyperlink will get
you to the screen where the invalid objects are validated.
As you can see, the database home page serves as a dashboard for everything that needs your attention. Instead of cluttering the screen with
detailed information, the interface has been made quite succinct with those details just a click away. You could compile all this information
manually, but it would take a lot of time and effort. EM 10g provides an out-of-the-box solution.
General Usage
Let's see how some of the more common tasks are accomplished through the new EM.
One common task is to alter a table and its corresponding indexes. From the Database home page, choose the "Administration" tab as shown in
Figure 3 and reference the item marked 6. From this page you can administer the database to configure undo segments, create tablespaces and
schema objects, set up resource manager, use the new Scheduler (to be covered in a future installment), and more. Choose "Tables" from there,
which brings up a screen as shown in Figure 4.
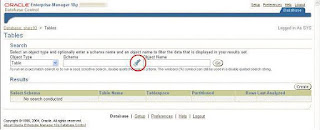
Figure 4: Table Management
Note the flashlight symbol highlighted inside a red circle; this is the button for bringing up a list of values. In the screen shown in the figure, you can
click on the LOV symbol to bring up a list of users in the database and select one from the list. Clicking on the button "Go" brings up a list of tables
for that user. You can also specify a wildcard with the "%" sign—for example, by using %TRANS% to bring up all the tables with the word TRANS in
the name.
Let's see an example. Choose the table TRANS to modify a column there. Clicking on the hyperlink brings up the "Edit Table" screen as shown in
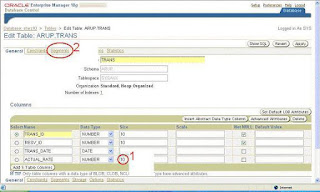
Figure 5.
Figure 5: Table Administration
If you want to modify the column ACTUAL_RATE from NUMBER(10) to NUMBER(11), you can modify the number (Ref 1) and click "Apply." To see
the actual SQL statement used to accomplish this task, can click the button "Show SQL."
Another important piece of information is available in the same screen: the growth trend. As you will learn in a future installment on segment
management, it is possible to observe object growth over a period of time. This screen offers that same information but in a graphical manner. To
see the screen, click on the tab "Segments" (Figure 5 Ref 2). This brings up the segment screen as shown in Figure 6.
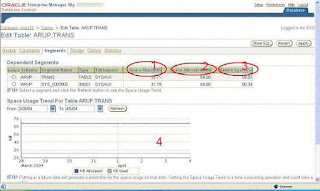
Figure 6: Segment Screen
Note the item marked inside the red circles. The screen shows how much space is allocated to the segment (2), how much is actually used (1), and
how much is wasted (3). On the bottom part of the screen (4), you can see a graph of the space used and allocated for the object. In this example,
the pattern of the table usage has been steady—hence the straight line.
You can perform other administrative operations on the table using the tabs for that purpose, such as "Constraints" for managing constraints.
Performance Tuning Using EM
As you've learned up to this point, although EM's look-and-feel has changed, it offers at least as much functionality as the previous Java version.
However, unlike the latter, EM now also supports newer Oracle Database functionality. For example, EM can now handle subpartitions.
However, experienced DBAs will want more from the tool—especially for troubleshooting problems or proactive performance tuning. Let's use an
example. Recall from the previous section that our database is waiting on the "Application" wait class as shown in the database home page (Figure
3 Ref 3) and that we need to diagnose the cause. One of the key things to understand in any tuning process is how various components such as
CPU, disk, and host subsystems interact, so it helps if all these variables are viewed together in context. To do that, choose the "Performance" tab
from the Database home page. This brings up the screen as shown in Figure 7.
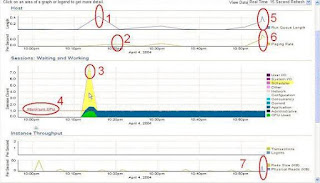
Figure 7: Performance Tab
Note how all the metrics have been aligned on the same timeline, which makes viewing their interdependencies easier. Note the spike (3), which
corresponds to the Scheduler task. It shows that some seven sessions were waiting for Scheduler-related waits at that time. So, what was the
impact? Note the CPU metrics located in the same place (the green area)—they indicate the maximum CPU ever used, as shown in the graph by
the broken line (4). Before and after that point, we don't see the CPU spikes occurring, which provides one clue. Note the spike in CPU run queue
length (1), which is a direct consequence of the Scheduler, which might have generated an excessive memory requirement, having caused the
increased paging activity (2). As you can see, all the symptoms fall in line to enable a better understanding of the database load "profile."
Note the spikes at the end of the timeline—increases in Run Queue Length (5) and Paging Rate (6)—which correlate to another spike in Physical
Reads (7). What is the cause?
By comparing the graph "Sessions: Waiting and Working" with the time the spikes were occurring, we can see that most of the sessions were
waiting on the "Application" wait class. But we need to find out exactly what it was waiting on during that time period. Click on the area at that time,
which brings up the Active Sessions screen as shown in Figure 8.
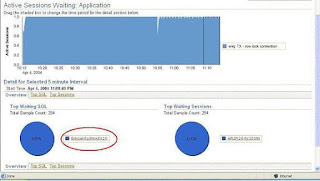
Figure 8: Active Sessions Waits
The screen shows that the sessions were waiting for the wait event enq: TX – row lock contention. So what was the SQL statement that
caused it? Simple: The SQL ID of the statement 8rkquk6u9fmd0 is shown on the screen itself (inside the red circle). Click on the SQL ID to bring
up the SQL screen as shown in Figure 9.
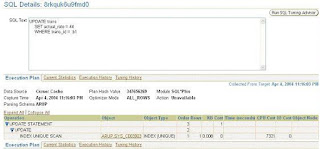
Figure 9: SQL Details
On this screen you can see the SQL statement and relevant details about it, including the execution plan. It turns out that this SQL was causing row
lock contention, so application design may be a source of the problem.
Latch Contention
Suppose that clicking on the "Performance" tab takes you to a screen similar to that shown in Figure 10.
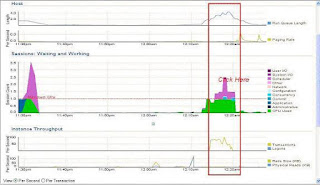
Figure 10: Performance Tab, Example 2
In the figure, note the metrics highlighted inside the red rectangle. You can see a lot of CPU-related waits around 12:20AM, which resulted in a
large run queue in the CPU. We need to diagnose this wait.
First, click on the graph on the area shown for CPU contention (marked with "Click Here" on the figure) to see that particular wait in detail, shown in
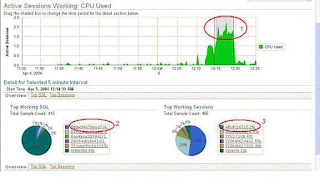
Figure 11.
Figure 11: Active Session Waits
Note the shaded box in the "Active Sessions Working: CPU Used" graph (1). You can drag it using the mouse to place the focus. This operation
causes the pie charts below (2 and 3) to be calculated only within the timeframe contained in that box. From there we see that a specific SQL with
id 8ggw94h7mvxd7 is working extra hard (2). We also see that the user session with username ARUP and SID 265 is a top worker (3). Click on the
session to see the details. This operation brings up a "Session Details" screen. Click on the tab "Wait Events" to bring up the details of the wait
events experienced by the session, similar to what you see in Figure 12.
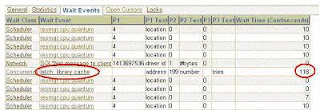
Figure 12: Wait Event Details
In this screen, note the longest wait of 118 centiseconds, highlighted inside a red circle, which is waiting for a library cache. When you click on the
hyperlink for "Latch: Library Cache," you will see a screen similar to that in
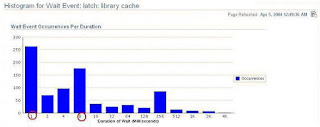
Figure 13.
Figure 13: Wait Histogram
This screen provides some unique information not available in pre-10g databases. While diagnosing our latch contention issue, how do you know
whether the 118 centi-second wait comprises many small waits in several sessions or just one large wait in only one session, thereby skewing the
data?
The histograms come to our rescue here. From the figure, you know that some 250 times sessions had a wait of 1 millisecond (highlighted inside a
circle). Sessions waited some 180 times somewhere between 4 and 8 milliseconds. This screen shows that the waits are typically for small
durations, making them insignificant symptoms of latch contention.
From the database home page you can access ADDM, SQL Access Advisor, and other Advisors by clicking on the tab marked "Advisor Central."
ADDM runs automatically as metrics are collected and the results are posted immediately on the Advisor Central page, which when clicked shows
the recommendations made by ADDM. The SQL Tuning Advisor also examines these metrics and communicates its recommendations on this
page. (We'll examine ADDM and SQL Tuning Advisor in much more detail in a future installment.)Labels: Enterprise Manager 10g |
posted by Srinivasan .R @ 12:32 PM  |
|
|
|
|
|
